Posts
Here I share my blog posts, presentations and reports
Traffic
Historical Similarity
Similarity-based forecasting is an area with a room for many new approaches. I work on Historical Similarity with applications on traffic-flow data. Here is a four post long series where I walk you through my work and discuss the results.
In the introductory post I explain the traffic flow data that I will use in all following contents and a paper I am co-authoring. I show some data exploration techniques and discuss the insights gained. Also there are some discussion about finding and solving missing data problem in big time series data sets.
The following post discusses using historical similarity in
time-series data with examples on traffic-flow. I discuss historical
similarity in detail. Then I explain some distance measures and their
advantages/disadvantages in our project. After I showcase the
R code structure and the problems that arise due to big
data. Finally I search for meaningful relationship between similar
trajectories and discuss my findings.
The third post is where I start forecasting. I use the similarity results of the trajectories from the previous post to make point forecasts. I discuss various point forecast approaches using similar trajectories.
Finally, I use the same similarity results, but this time it is interval forecasting. I also discuss my other studies concerning prediction intervals in this post.
Below you can access the posts.
Istanbul - Mini Project
I also worked on Istanbul’s traffic data. Missing data was a big problem and it was only 1 year long, however the results were consistent with my other projects and the literature.
I showcase one of my small projects:
Wind
During my thesis studies, I prepared many reports and presentations.
I want to share one of my booklets in which I analyze the effect of
derived features on spatio-temporal wind-speed data set. It also has a
second chapter, I may add upload it in the future. Also I share one of
my detailed jupyter notebooks for anyone interested in the coding
workflow. Finally I put a fun pdf with interesting visual patterns of
Kronecker principal components. It may seem unclear but it surely can be
used as a food for thought about how eigen() is implemented
in R language.
Football
Lately, many great football statistics are being shared to public. I used open source data containing time-stamped and location specific events from Euro 2018 football games to analyze football games, attack styles and player significance. My studies are not concluded yet and I am not able to share my statistical findings, however you can access my custom made tool for visualizing attack sets and a small presentation of my preliminary field research about this topic.
- Custom Tool for Visualizing Attack Sets (May take a minute to load)
- Presentation - Attack Styles
- Open Source Data that I use (Note that there are even more detailed free data sets being released.)
Hackathon

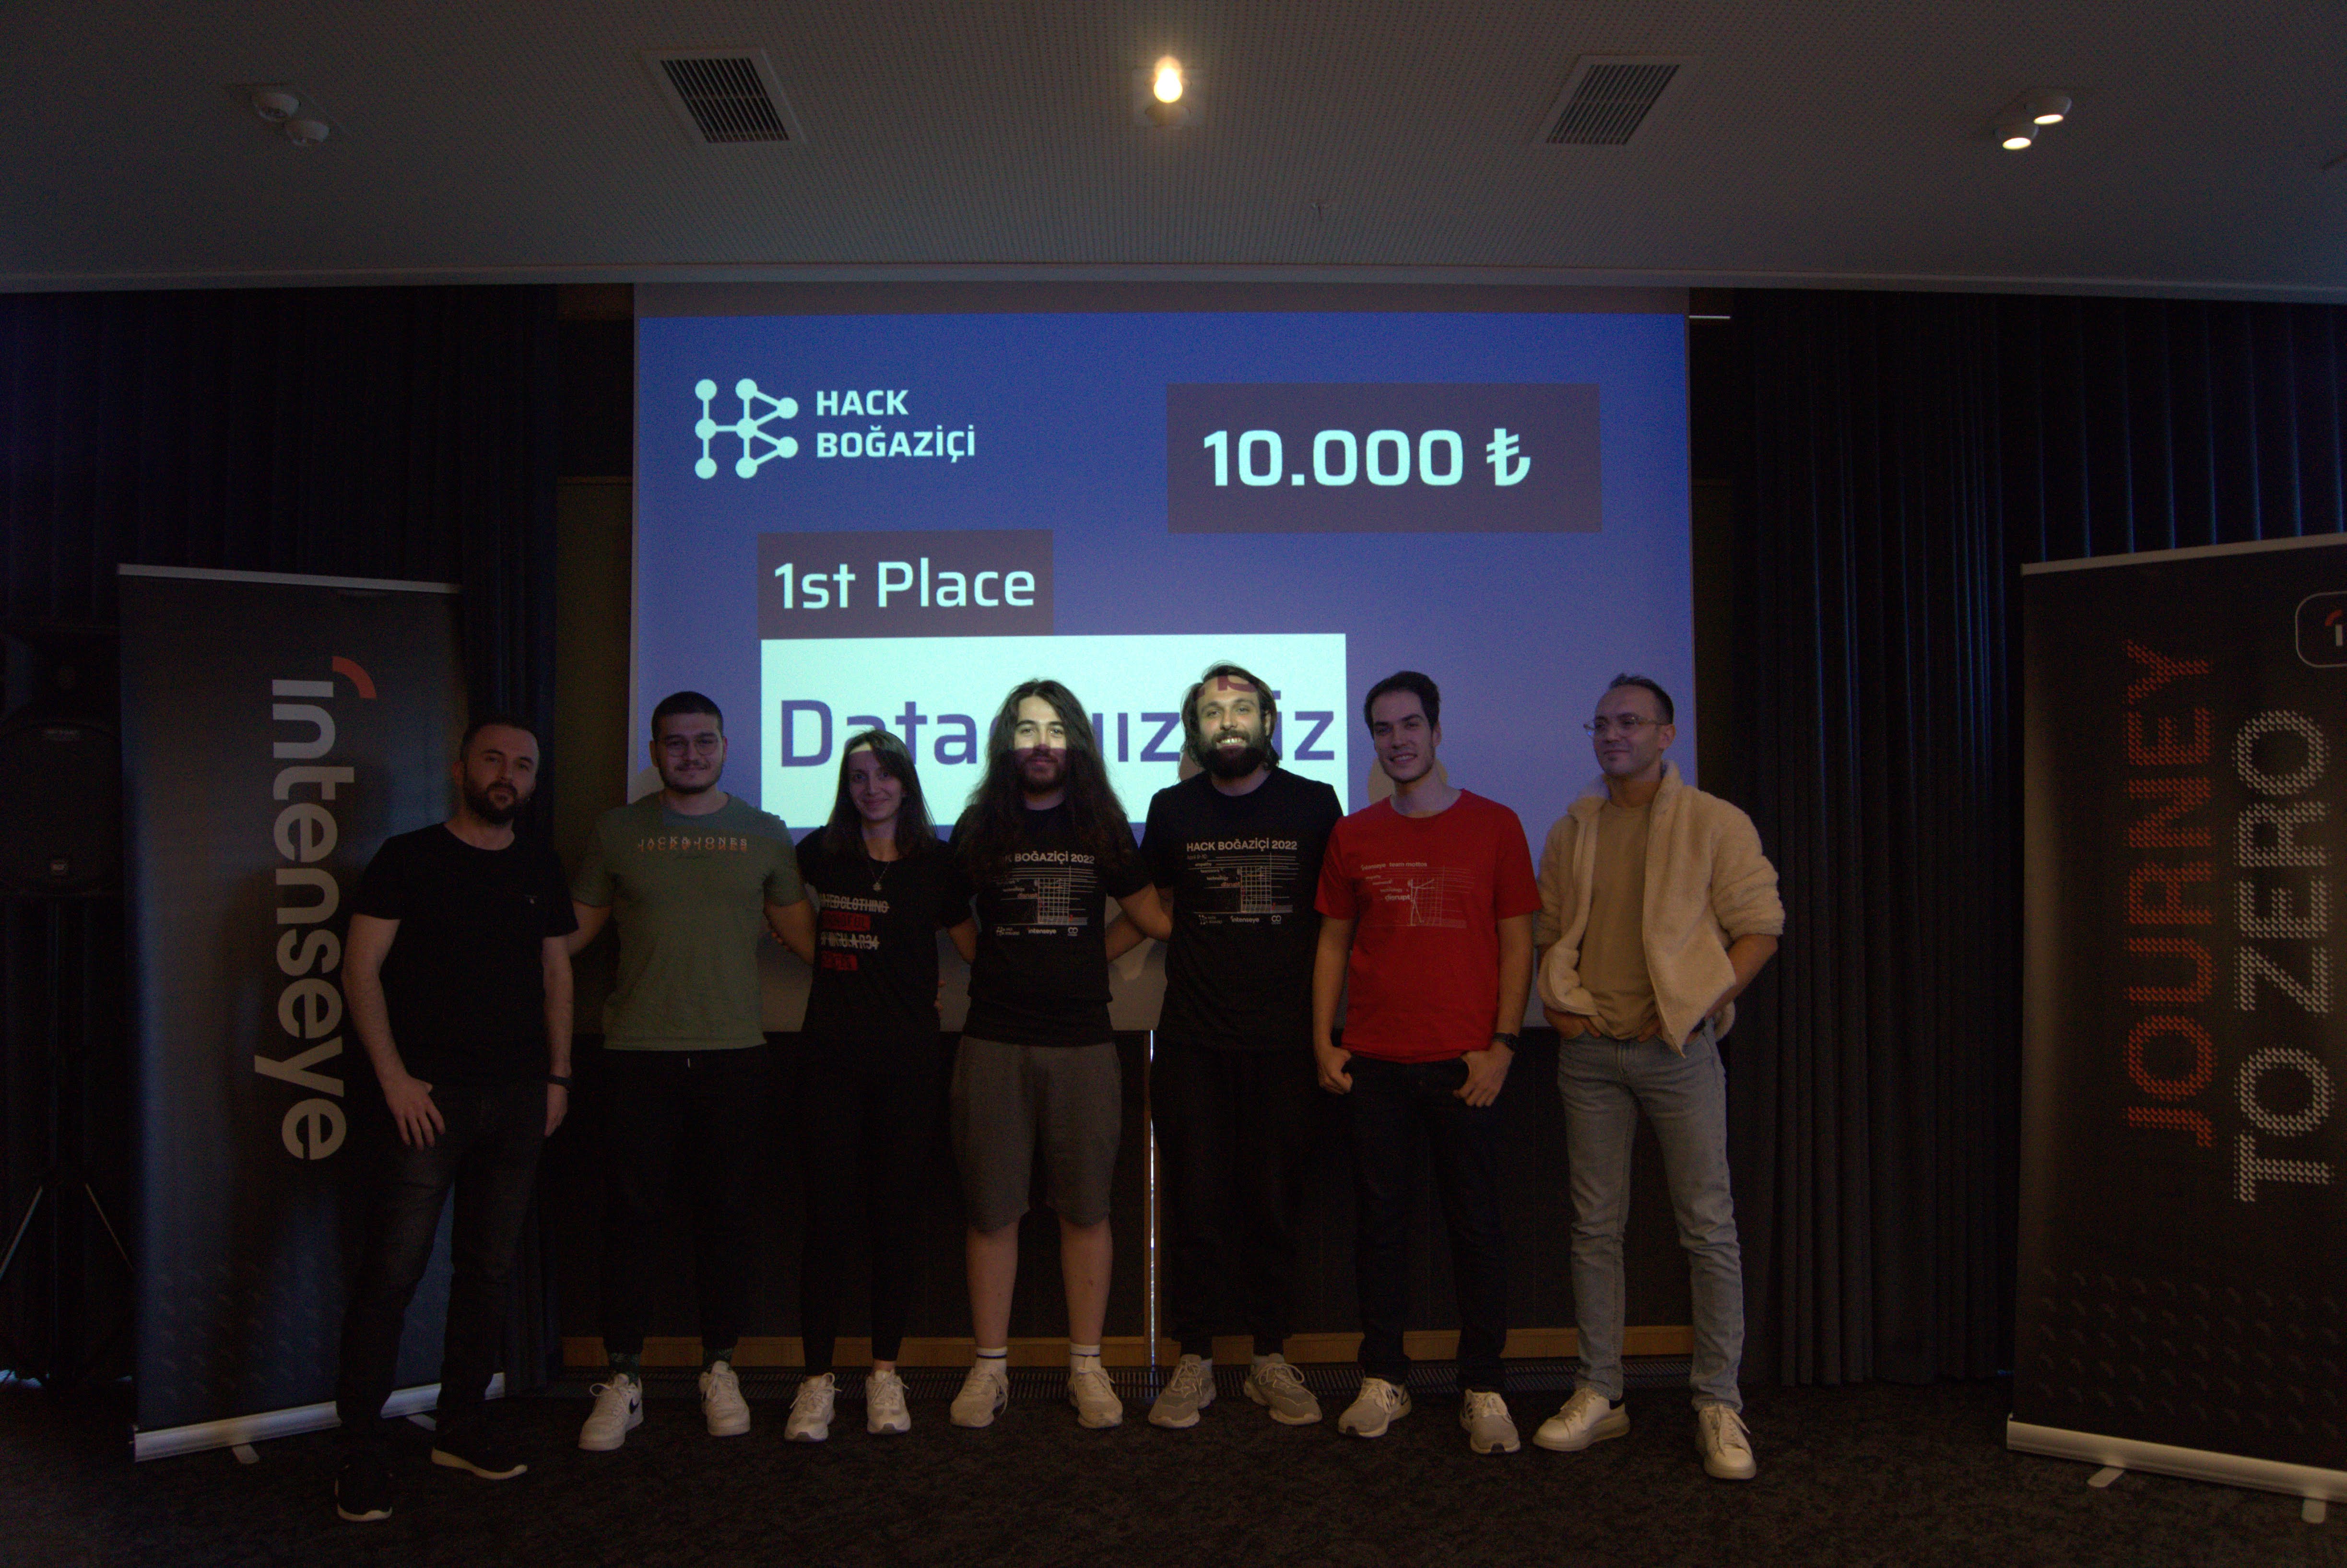
As four mathematicians, we participated in Hack Bogazici. Hackathon was titled as “Using ML to help companies progressing into Industry 4.0”. Our optimal route finder app for macro and micro logistic companies that takes possible accidents into account won the competition. I can say that in that 24 hours I found a chance to test my managing and marketing (convincing) skills as well as practicing my project designing and coding routines in a more stressful environment.
Educational Material
Quantile Regression and Combining Forecasts
Using forecasts as derived features is a quite popular topic which
also has great room for improvement. In 2014, Nowotarski and Weron
presented Quantile Regression Averaging to combine point
forecasts to obtain prediction intervals. Their method was pretty strong
and this lead many people to start working on this subject.
As the topic is relatively very new, there are not enoug material online. Thus I decided to create a series of educational blog posts. Couple of them are incomplete but they will be ready soon to be shared.
Before checking these posts, you may want to read about Quantile Regression. I recommend Koenker’s book “Quantile Regression” but also there are other nice material online.
Quantile Regression Averaging with R (in progress)